Journal Rejects Your Figures for Formatting? Create Publication-Ready in 3 Minutes
Upload your data, describe your chart in plain English, and download journal-formatted figures for Nature, Science, or Cell. AI-powered formatting ensures compliance with 100+ journal requirements—no manual adjustment needed.
AI-Powered Chart Generator
Get instant, data-driven feedback on your academic charts with Viz LLM's AI Academic Chart Generator. Optimize for clarity, compliance, and visual impact using the most advanced Chart Generator.
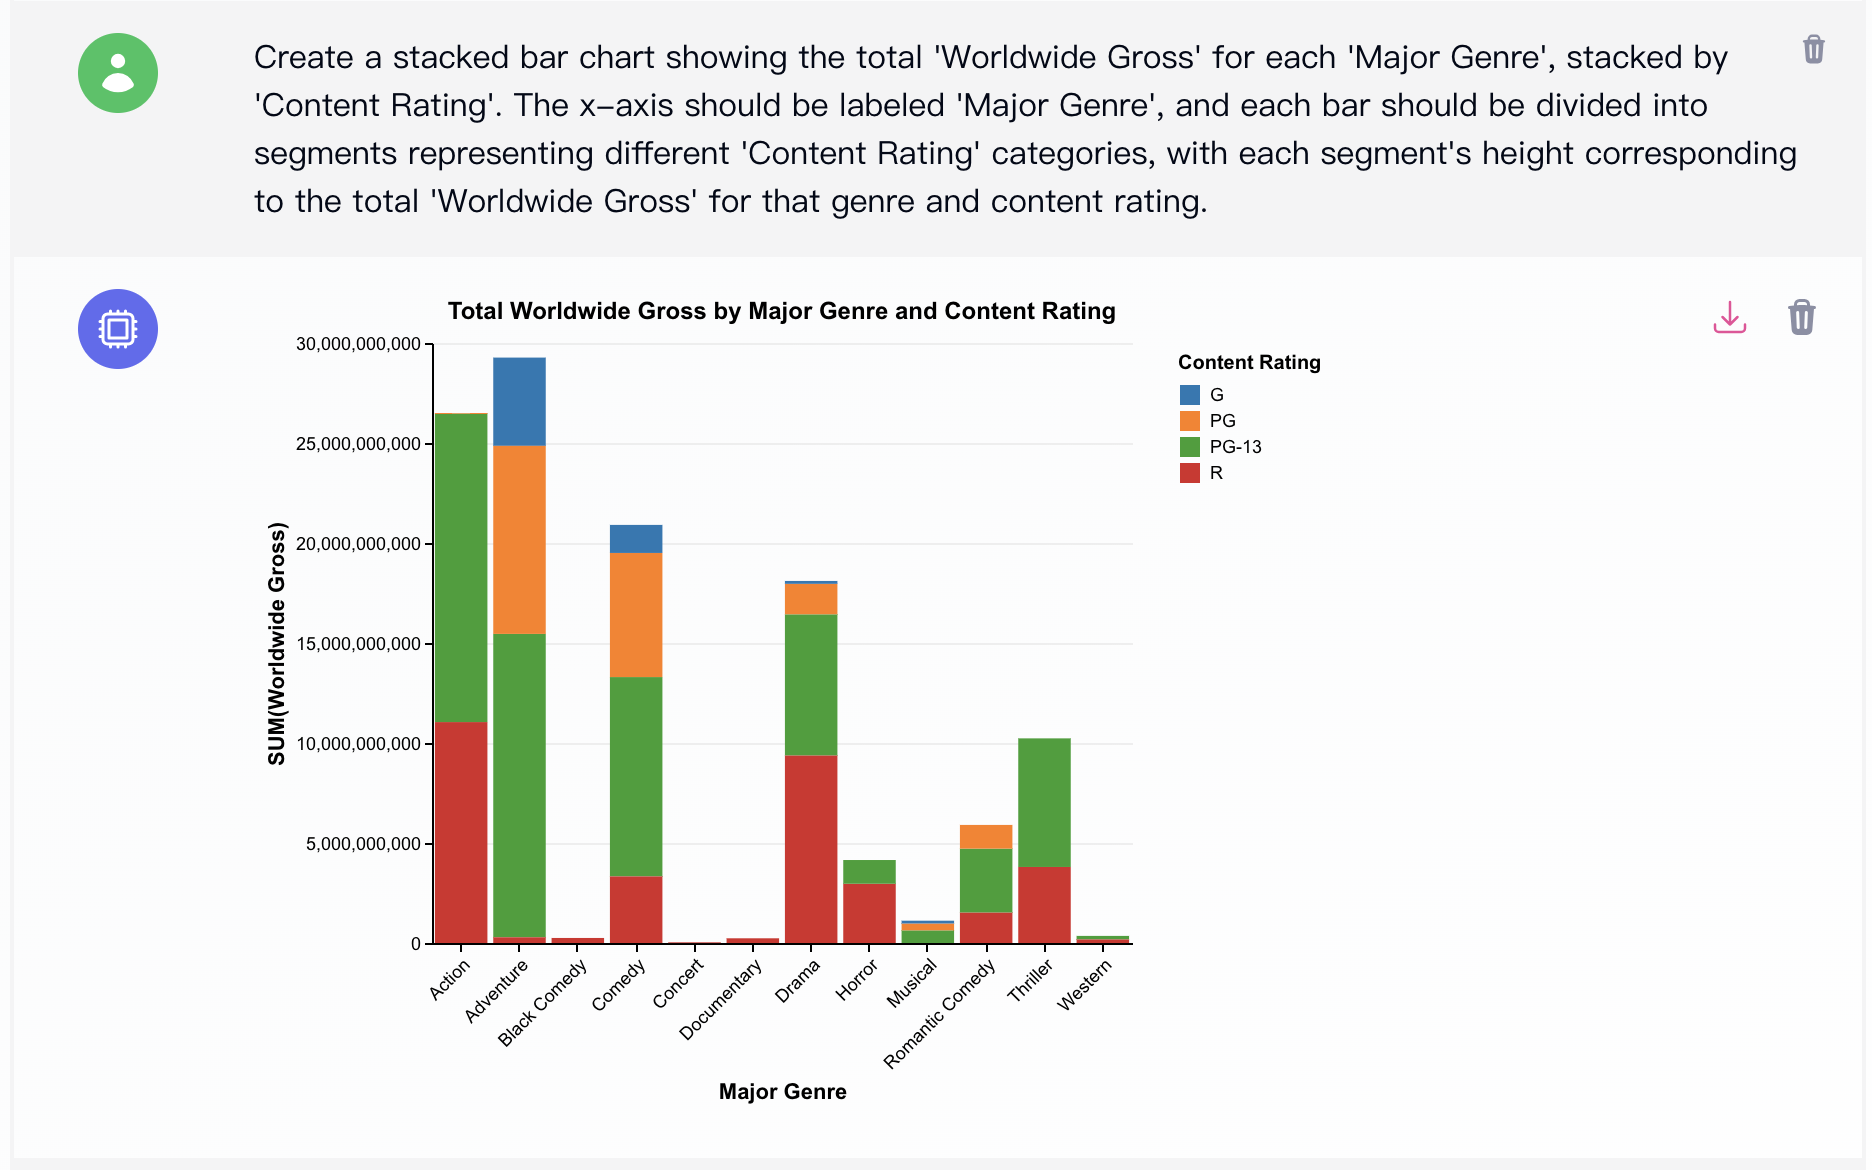
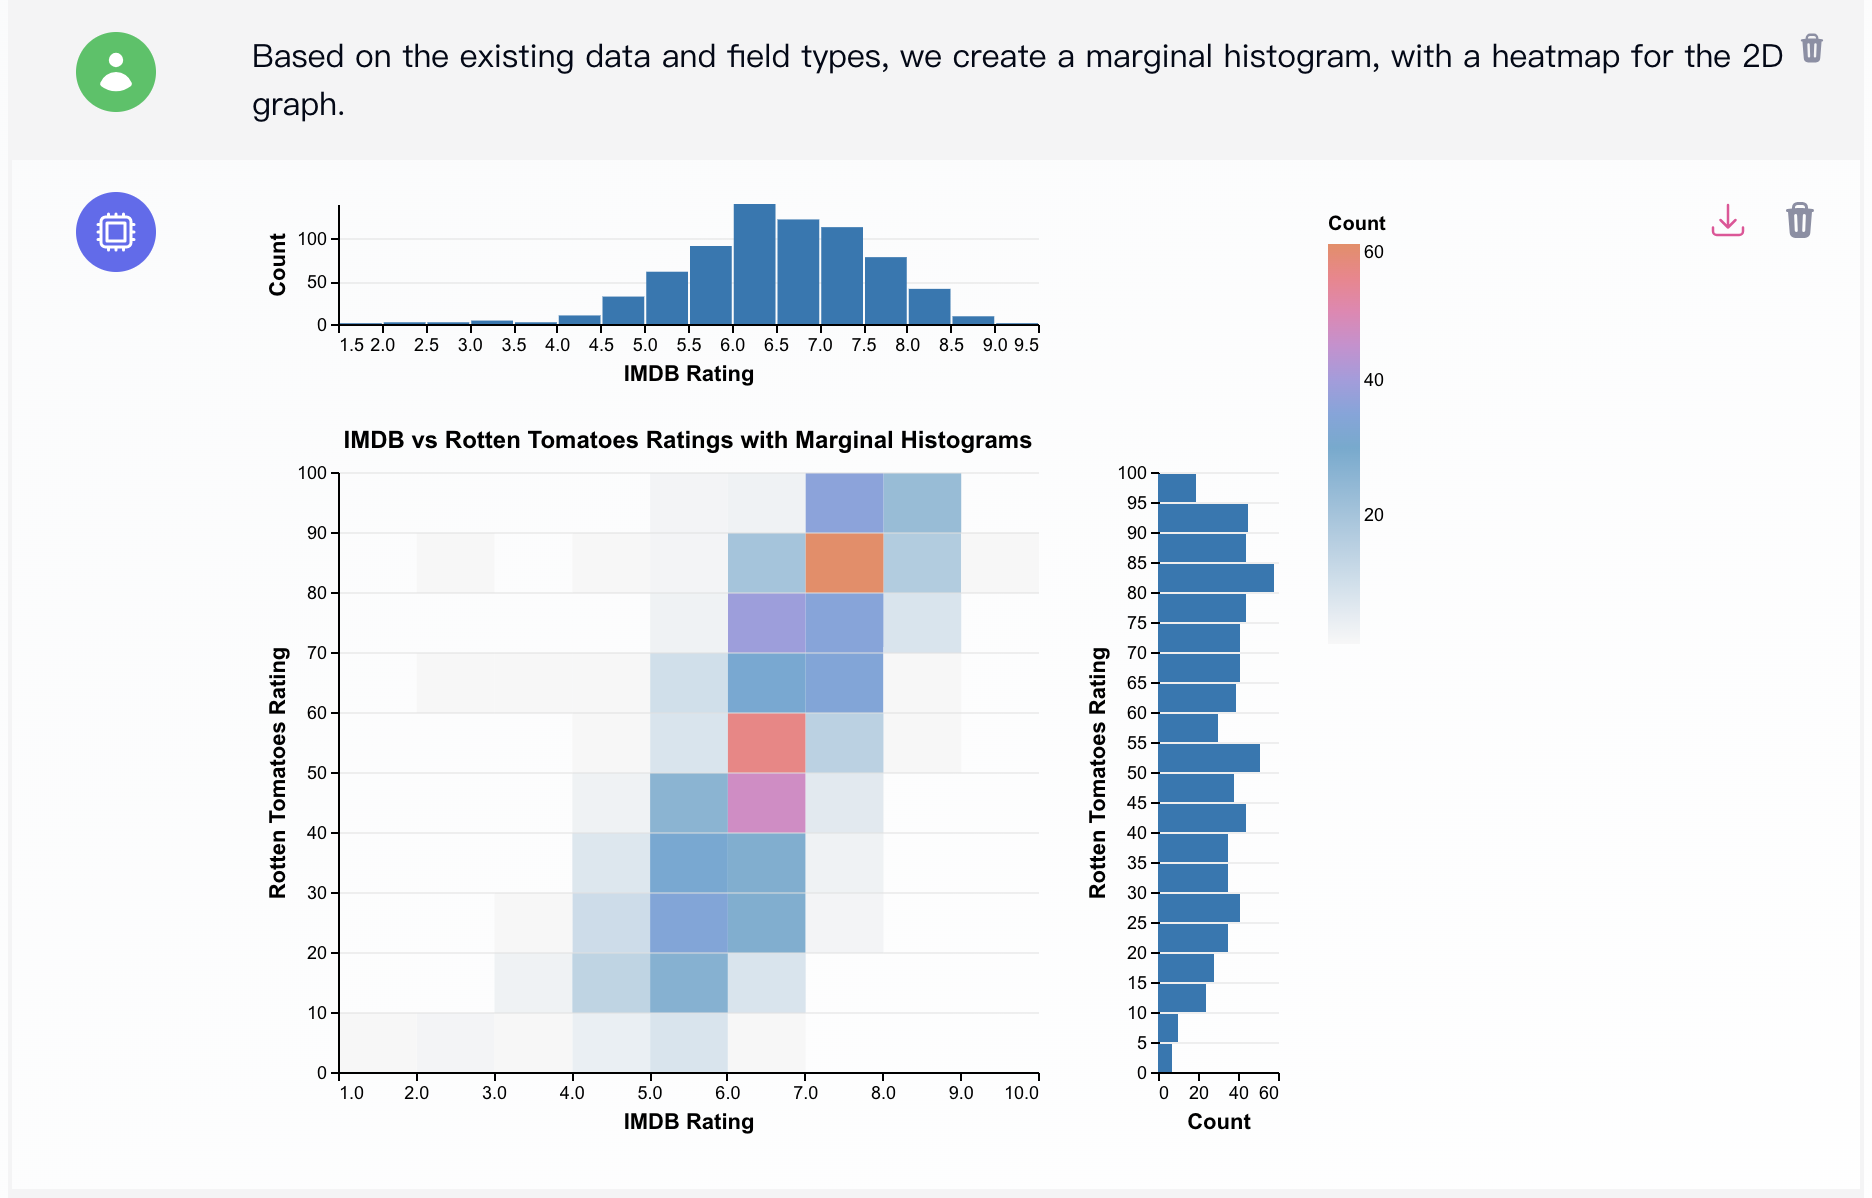
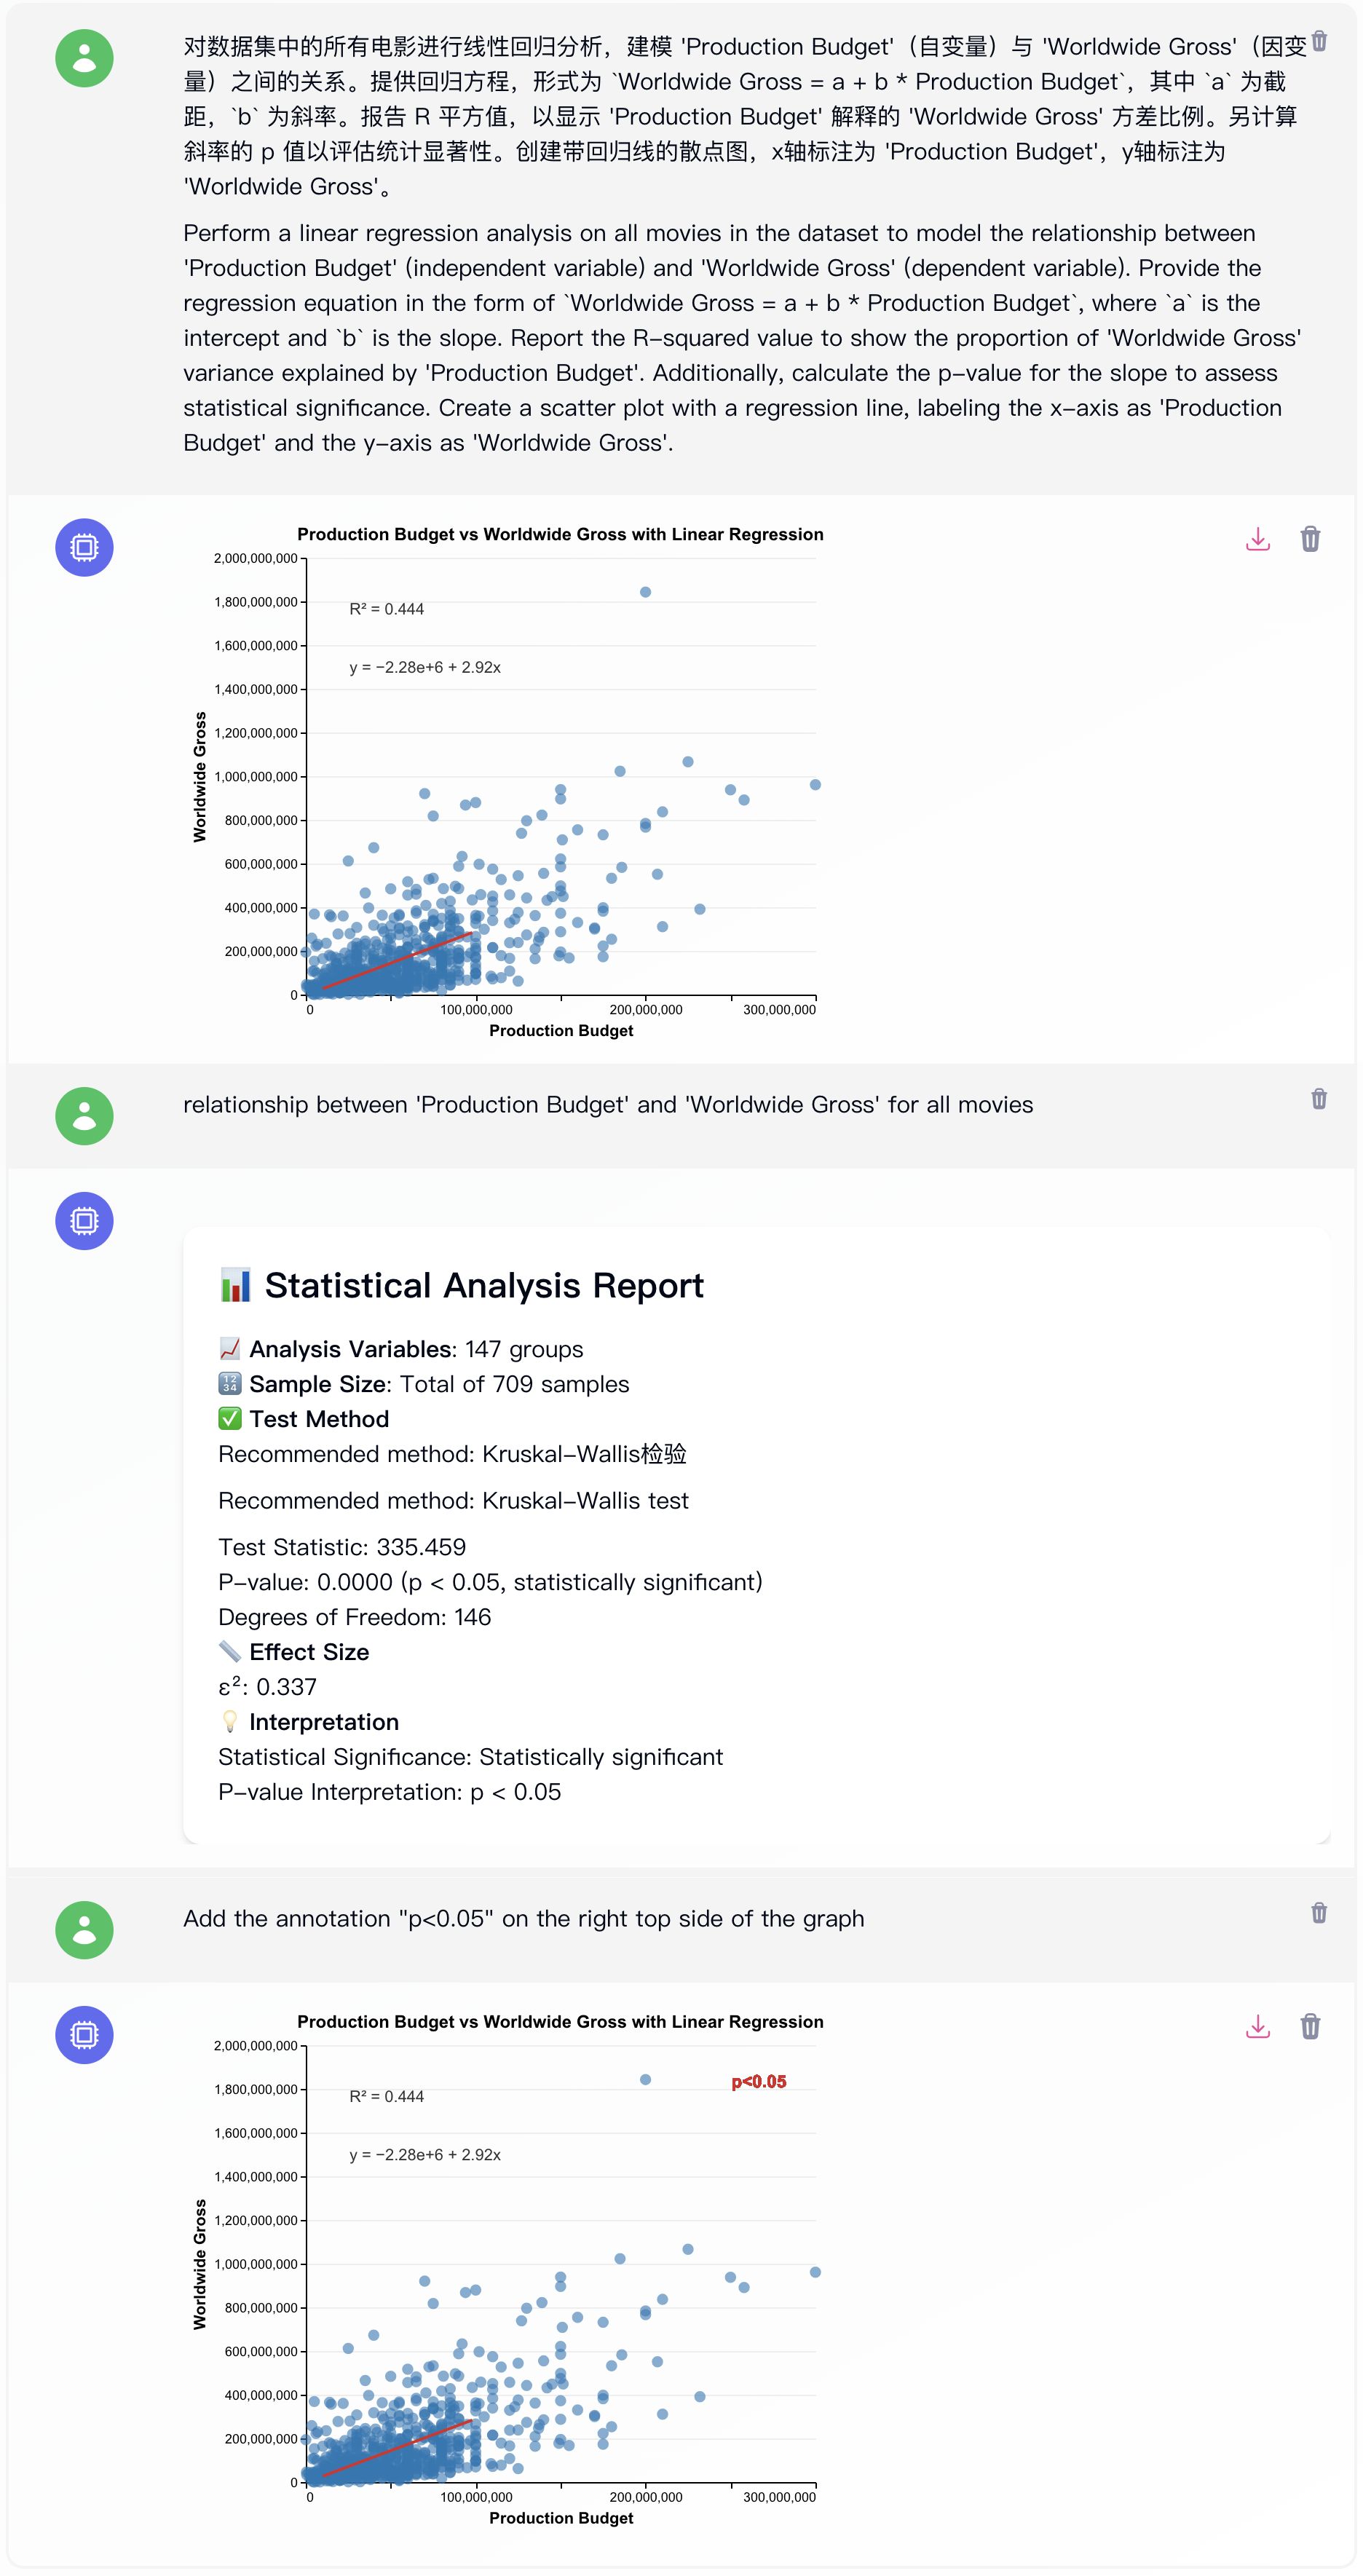
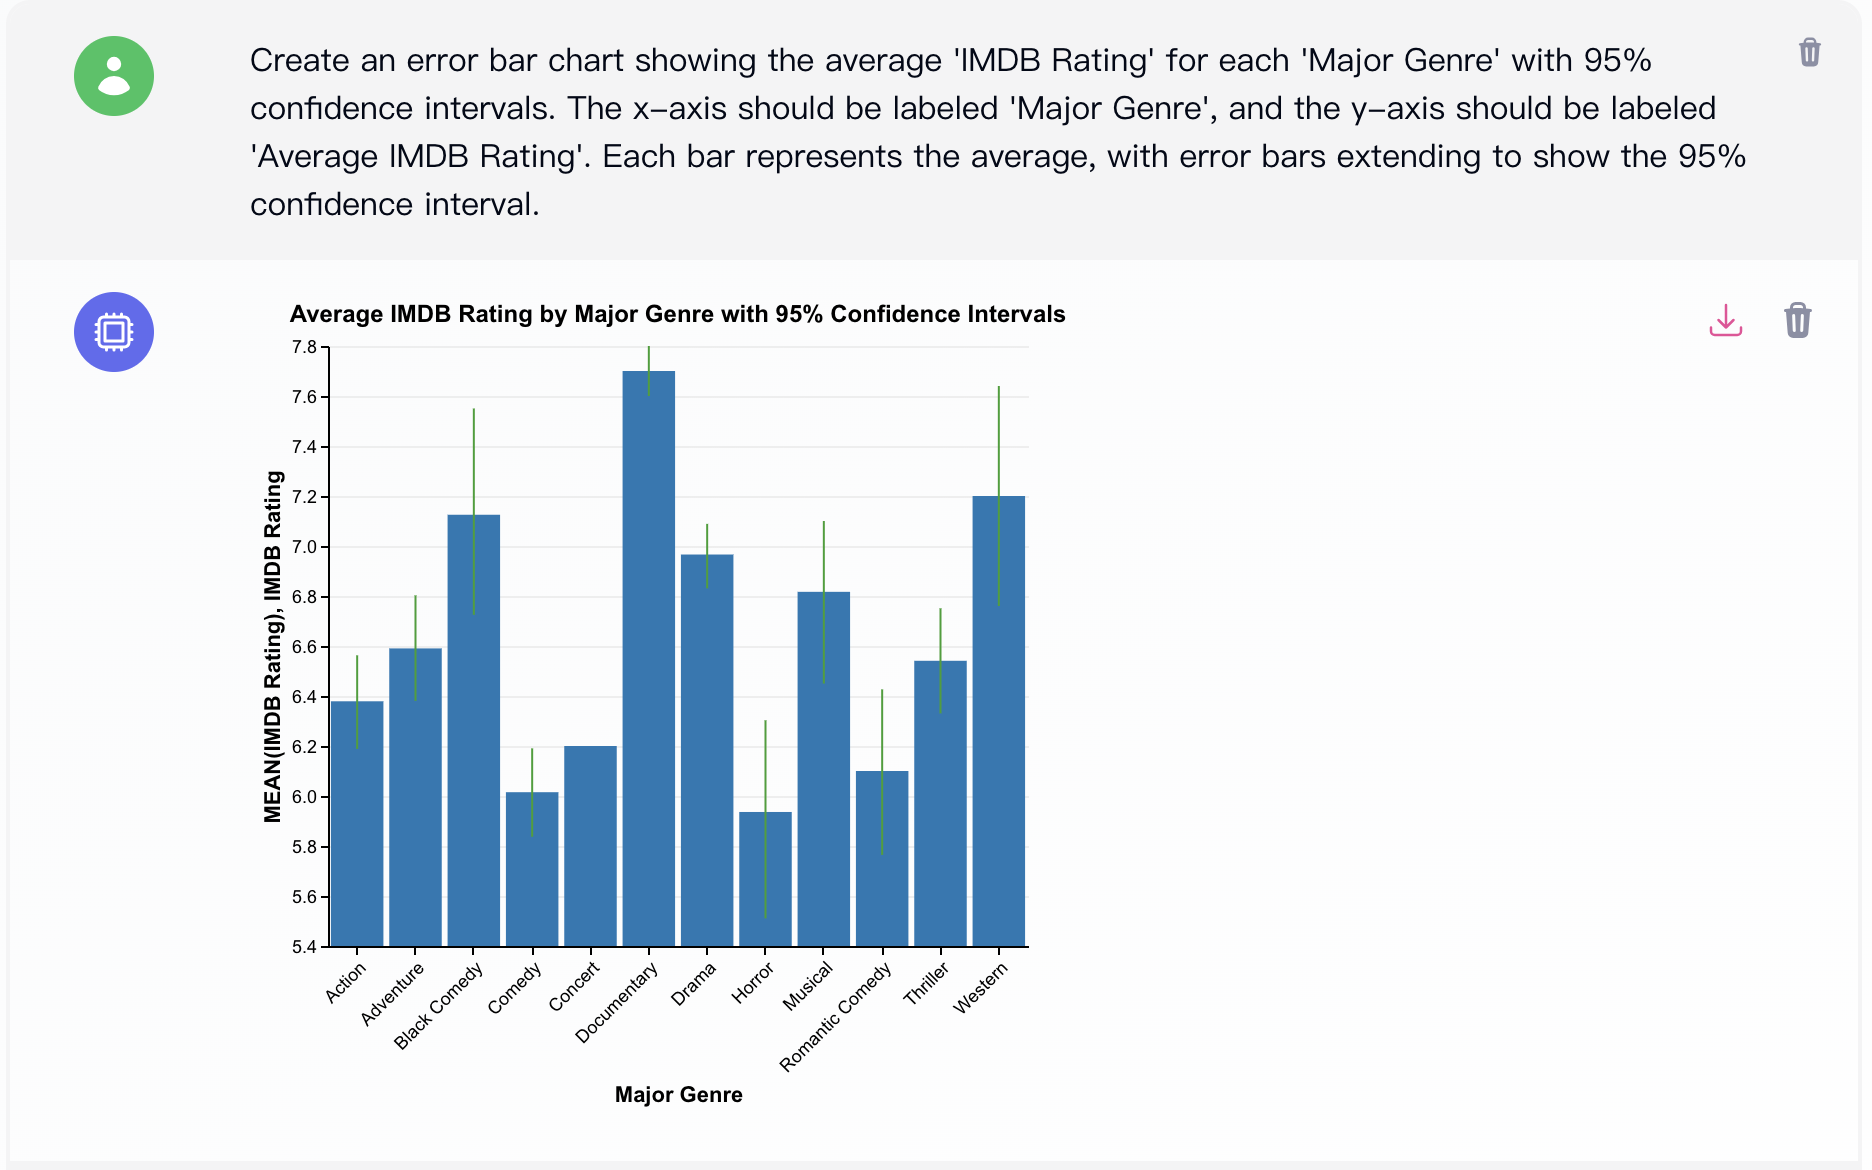
AI Academic Chart Showcase by Viz LLM
Explore how Viz LLM AI Academic Chart Generator creates advanced academic charts, including error bar charts, stacked bar charts, distribution heatmaps, and regression analysis with statistical reports. All academic charts below are generated by Viz LLM's AI Academic Chart Generator, ready for publication and scientific research.
Academic Chart Generator Features: Transform Your Research Workflow
Our AI-powered figure generator helps researchers create journal-grade charts with precision and speed. Discover the features that make this academic chart generator essential for scientific publishing.
LLM-Powered Format Matching
Adapt your figures to 100+ journal requirements automatically. The chart generator matches dimensions, fonts, and resolution for top journals like Nature (89mm single column), Science (5.5cm width), and Cell (85mm width) without manual adjustment.
- One-click journal format adaptation for Nature, Science, Cell, PNAS, and 100+ journals
- Automatic size, font (6-8pt), and DPI (300-600) compliance
- Real-time preview of how your figure will appear in the published article
- Saves 2-3 hours per figure on formatting and revision cycles
AI Color Engine Trained on 300M Papers
Our academic figure generator analyzes color schemes from 300 million published papers. Get discipline-appropriate, colorblind-friendly palettes that meet journal standards and enhance data clarity.
- Biomedical research: cool tones (blues, greens) for clinical data visualization
- Social sciences: warm palettes (oranges, reds) for demographic and survey charts
- Physics & engineering: symmetry-preserving color domains for technical figures
- All palettes are colorblind-safe (deuteranopia, protanopia tested) and print-optimized
Conversational Dynamic Annotation
Add statistical annotations using natural language commands. This chart generator understands requests like 'add p<0.05 asterisks between groups' or 'label the peak at 450nm' and generates publication-ready annotations with optimal positioning.
- Bilingual support: English and Chinese labels, plus LaTeX mathematical notation
- AI-powered positioning: automatically places annotations to avoid data overlap
- Statistical symbols: p-values, confidence intervals, significance brackets, error bars
- Export-ready: annotations scale correctly in SVG, PNG, and PDF formats
Multilingual & Multi-format Output
Export publication-ready figures in multiple formats with one click. The academic chart generator produces SVG (vector), PNG (raster), and PDF files with embedded fonts, correct color profiles (RGB/CMYK), and bilingual legends.
- SVG vector export: infinite scaling, editable in Adobe Illustrator or Inkscape
- High-resolution PNG: 300-600 DPI for print journals and conference posters
- PDF with embedded fonts: ready for direct journal submission systems
- Bilingual legends: English/Chinese captions for international collaboration
How the Academic Chart Generator Works: Three Steps to Journal-Ready Figures
Our AI-powered figure generator streamlines your research workflow. Create publication-grade charts in three simple steps—from data upload to journal submission.
Upload Data & Describe Your Chart
Upload your dataset (CSV, Excel, SPSS) or paste a table. Type your request in plain English: 'Create a scatter plot showing correlation between variables A and B' or 'Draw a survival curve in Nature format.' The chart generator understands your intent immediately.
AI Generates Your Figure (15-30 seconds)
Our academic chart generator selects the optimal visualization type, applies your target journal's formatting requirements (dimensions, fonts, DPI), and suggests discipline-appropriate color schemes from our 300M-paper training database. Real-time preview shows exactly how your figure will appear in print.
Download & Submit to Journal
Export your publication-ready figure as SVG (vector), PNG (300-600 DPI), or PDF with embedded fonts. All formats include bilingual legends and meet journal submission requirements. Most researchers go from data to submission-ready figure in under 3 minutes.
Viz LLM Chart Generator FAQ
Frequently Asked Questions about Viz LLM Chart Generator
Viz LLM is the first academic Chart Generator powered by large language models (LLM). Key advantages include:
- Conversational interaction: simply describe your needs in natural language (e.g. 'generate a heatmap in Cell format'), and the Chart Generator will automatically parse and create your chart;
- Deep academic adaptation: built-in library of 100+ journal formats, 300 million paper-based color schemes, bilingual annotation and LaTeX support;
- Smart optimization: the Chart Generator detects data issues (like inconsistent wavelength units) and helps optimize your chart's narrative, letting your data tell its own story. Viz LLM Chart Generator is the most advanced solution for academic charting.
You can create a journal-ready chart in three steps:
- Upload your data (Excel, CSV, SPSS, or paste a table);
- Enter a prompt (e.g. 'draw a ROC curve with confidence interval');
- Export with one click: select your target journal format and download SVG/PNG vector graphics or LaTeX code. Tip: Try the demo dataset to experience the full Chart Generator workflow with Viz LLM.
Yes! Viz LLM Chart Generator offers: Free Basic Plan: supports common journal format matching and basic color schemes; Pro Plan (subscription): unlocks the full journal library (including top journals like Nature and Science), CMYK/RGB modes, and priority support. All plans include a satisfaction guarantee—cancel anytime, no long-term contracts. Viz LLM Chart Generator is transparent and user-friendly.
Data security is our top priority. All uploads are encrypted in transit and at rest. Your data is stored in a private, isolated environment—no one else (not even us) can access it. All data and generated charts are permanently deleted after 1 hour of inactivity. (GDPR compliant; additional confidentiality agreements available for government or sensitive projects.) Viz LLM Chart Generator is trusted by researchers worldwide.
Viz LLM's Chart Generator is designed to accelerate research productivity, not to replace tools like Adobe Illustrator. Our Chart Generator focuses on automating 80% of repetitive chart work (formatting, color optimization), meeting academic needs (multilingual annotation, journal compliance), and enabling fast iteration (real-time chart editing via conversation). The goal: save you 2 hours a day on charting, so you can focus on your research. Viz LLM Academic Chart Generator is your research accelerator.
Viz LLM's Chart Generator supports a comprehensive range of chart types across multiple disciplines, including but not limited to: Biomedical (survival curves, pathway diagrams, heatmaps); Social Sciences (correlation matrices, network graphs); Finance (time series, violin plots); and all common data visualization needs like histograms, bar charts, line charts, scatter plots, pie charts, bubble charts, box plots, area charts, and more. We are constantly updating—submit your chart needs anytime to Viz LLM Chart Generator.
Absolutely! Viz LLM's Chart Generator supports personalized adaptation:
- Template upload: import your lab's PPT/LaTeX chart templates and the Chart Generator will learn your color, font, and annotation preferences;
- Style fine-tuning: adjust details via prompt (e.g. 'increase line contrast', 'reduce bar spacing by 20%');
- Version management: save presets for your team, ensuring visual consistency across all charts. Many research groups have improved their charting efficiency and reviewer feedback with Viz LLM Chart Generator.
Viz LLM's Chart Generator uses a three-layer quality check:
- Format library: always up-to-date with the latest journal standards;
- AI pre-check: automatically verifies 20+ parameters (font, size, resolution, etc.);
- Manual review: Pro users can request a second check by our editorial team (extra fee). 92% of users pass peer review on their first submission with Viz LLM Chart Generator.
Viz LLM Chart Generator's format library is designed for both comprehensiveness and usability. Here's how we organize our formats:
- Unique Journal Styles: We've identified 10+ distinct journal styles with specific formatting requirements (e.g., Nature, Science, Cell). Each has been carefully implemented to meet exact specifications;
- Optimized Default Style: Approximately 95+ additional formats use our optimized Default style, which has been designed to meet the requirements of most academic journals. This approach ensures you get the right formatting while keeping the interface clean and easy to use. The Viz LLM Chart Generator team continuously updates our format library based on user feedback and journal requirements. If you need a specific journal format that's not listed, please contact our support team at support@vizllm.com for assistance.
Viz LLM Chart Generator uses a credit-based system for chart generation and advanced statistical analysis. Here's how credits are consumed:
- Each time you generate an academic chart from your data, 15 credits will be deducted.
- Each time you use the @p command to perform advanced statistical calculations (such as significance tests, effect size, or confidence intervals), 50 credits will be deducted.
- If you generate a chart and use @p in the same operation, credits will be deducted for both actions (total 65 credits). The quality of the generated chart or report depends on the clarity and professionalism of your prompt. Credits are deducted for each operation regardless of whether you save or download the result.
- For best results, please provide clear and detailed instructions when generating charts or requesting statistical analysis.
🔥 Experience Viz LLM Chart Generator Now!
Free: Basic format matching | Pro: Full journal format library + priority support. Viz LLM Chart Generator is your partner for fast, accurate, and compliant academic charting. Try Viz LLM Academic Chart Generator today.