100+ Chart Types for Academic Research & Data Visualization
Explore comprehensive chart types for every research need. Our chart types library includes distribution chart types, comparison chart types, relationship chart types, and specialized academic chart types. Find the right chart type for your data and create publication-ready visualizations with the perfect chart types for your discipline.
No credit card • 100+ chart types • All academic disciplines
Distribution
Visualize data spread, patterns, and frequency
Relationship
Show correlations and trends between variables
How to Choose the Right Chart Type: Chart Types Selection Guide
Not sure which chart types to use for your research? Follow this chart types decision guide to select the best chart types based on your data and research goals
Distribution Chart Types: Understanding Data Spread & Patterns
Distribution chart types reveal how your data is spread across values. These chart types show whether values are clustered or dispersed, identify multiple peaks in your data, and highlight outliers worth investigating.
Use distribution chart types when you need to understand the shape, center, and spread of your data. These chart types are perfect for identifying normality, skewness, and potential outliers before statistical analysis.
Histogram
Best for: Large datasets (n > 100), showing frequency distributions in discrete bins
Example: Exam score frequencies across 500 students, or gene expression levels
Density Plot
Best for: Smooth curves, comparing multiple overlapping distributions
Example: Comparing protein concentrations across three treatment groups
Box Plot
Best for: Quick summary statistics, outlier detection, many group comparisons
Example: Patient recovery times across 10 different hospitals
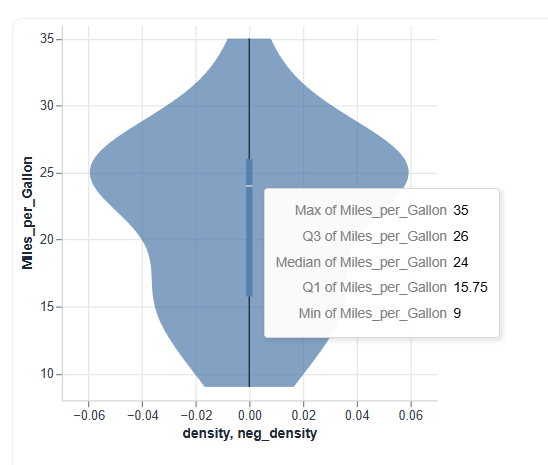
Violin Plot
Best for: Publication figures combining density shape with quartile statistics
Example: Nature/Science papers showing both distribution and summary stats
Pro Tip: Among distribution chart types, use box plots for quick comparison of many groups. Switch to violin or density chart types when distribution shape is important for your research story.
Comparison Chart Types: Side-by-Side Category Analysis
Comparison chart types make differences between groups immediately visible. These chart types help you determine which category has the highest value and identify consistent patterns across groups.
Use comparison chart types when you have categorical data and want to highlight differences between groups, rankings, or changes across categories. These chart types excel at visualizing categorical comparisons.
Bar Chart
Best for: Comparing values across 3-10 categories, clear ranking visualization
Example: Average patient satisfaction scores across 5 hospital departments
Grouped Bar Chart
Best for: Comparing multiple variables within each category (2-4 groups)
Example: Test scores by gender across different schools (2 groups × 5 schools)
Heatmap
Best for: Large matrices, gene expression, correlation patterns
Example: Expression levels of 50 genes across 20 tissue samples
Pro Tip: Keep comparison chart types simple with 3-10 categories. For more categories, consider other chart types like dot plots or heatmaps for better readability.
Relationship Chart Types: Correlations & Trends Visualization
Relationship chart types reveal how variables interact and correlate. These chart types help you discover whether variables are correlated, if one variable predicts another, and identify temporal trends or patterns in your data.
Use relationship chart types when exploring connections between continuous variables, identifying correlations, or showing how values change over time. These chart types are essential for correlation analysis and trend visualization.
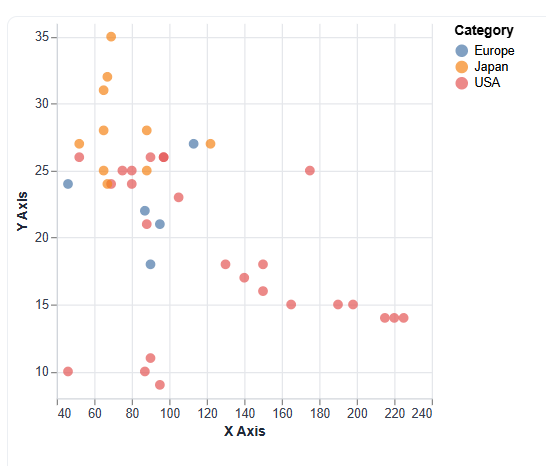
Scatter Plot
Best for: Exploring correlations between two continuous variables (n = 20-1000)
Example: Relationship between study hours and exam scores, or drug dose vs response
Line Graph
Best for: Time series, trends over time, continuous progression
Example: Stock prices over months, patient temperature over 24 hours, or population growth
Bubble Chart
Best for: Three variables at once (x, y, size), showing multidimensional relationships
Example: GDP vs life expectancy, with bubble size showing population
Pro Tip: When using relationship chart types like scatter plots, always add a trend line or correlation coefficient in academic papers. For time series chart types, consider adding confidence intervals to show uncertainty.
Composition Chart Types: Part-to-Whole Visualization
Composition chart types show how a whole is divided into parts. These chart types reveal what percentage each component represents and how proportions change over time or across groups.
Use composition chart types when you need to show relative proportions, percentages, or how parts make up a whole. These chart types are best for data that sums to 100% or represents shares of a total.
Pie Chart
Best for: Simple proportions with 2-5 categories, emphasizing one dominant slice
Example: Budget allocation across 4 departments, or market share of top 5 companies
Stacked Bar Chart
Best for: Comparing composition across multiple groups or time points
Example: Disease prevalence by age group and gender, showing both total and breakdown
Treemap
Best for: Hierarchical data with many categories, nested proportions
Example: Research funding by field and sub-field, or file system space usage
Pro Tip: When selecting composition chart types, avoid pie charts with more than 5 slices—use bar chart types instead. For academic papers, stacked bar chart types are generally preferred over pie chart types for their precision.
Why Choose Our Chart Types Library for Academic Research
Creating the right chart types for academic publications shouldn't be painful. Our comprehensive chart types platform solves common visualization challenges:
Journal rejects your figures for formatting issues
Every journal has different DPI, width, font, and color requirements. Nature wants 300 DPI at 89mm single-column, Science needs different specs, and PLOS has its own rules. VizLLM automatically formats to match your target journal's submission guidelines—no more desk rejections for technical formatting.
Hours tweaking colors only to fail colorblind-accessibility checks
Most charts use generic rainbow colors that fail accessibility standards and look unprofessional in academic contexts. VizLLM's AI, trained on 300M published papers, automatically selects colorblind-safe palettes appropriate for your research field—Biology, Economics, Medicine, or Physics.
Copying data between Excel, R, Python, and graphing tools
The typical workflow wastes hours: clean data in Excel, export to CSV, write R/Python code, debug visualization libraries, manually adjust in Illustrator. VizLLM handles the entire pipeline—upload your data, describe what you need in plain English, and get a journal-ready figure in 60 seconds.
No statistics background but reviewers demand p-values and confidence intervals
Reviewers expect proper statistical tests, but not everyone has advanced stats training. VizLLM's @p agent automatically runs appropriate tests (t-tests, ANOVA, regression), calculates effect sizes, adds significance markers, and includes confidence intervals—all statistically rigorous and clearly documented in your figure.
Join 50,000+ researchers who've saved 100+ hours on data visualization
Frequently Asked Questions About Chart Types
What are the most common chart types for academic papers?
How do I choose the right chart type for my data?
Can VizLLM create chart types for my specific journal?
What makes academic chart types different from business chart types?
Stop Wasting Time on Chart Formatting
Generate publication-ready figures in 60 seconds instead of 6 hours
Upload your data. Describe what you need. Get journal-ready charts instantly.
No credit card required Export to all formats 100+ journal templates